Shift Optimization Problem
The shift optimization problem is the problem of finding the optimal cost under several constraints. Here we show an example of shift optimization based on This formulation.
Problem Description
Overview
Suppose that we want to allocate multiple jobs to multiple workers. You have to pay a cost per worker. Given the start time and end time of each job and the costs of each worker, minimize the workers' cost under the constraints;
- Each job needs one worker
- A worker cannot do multiple jobs at the same time
The figure below is a picture of the shift optimization problem.
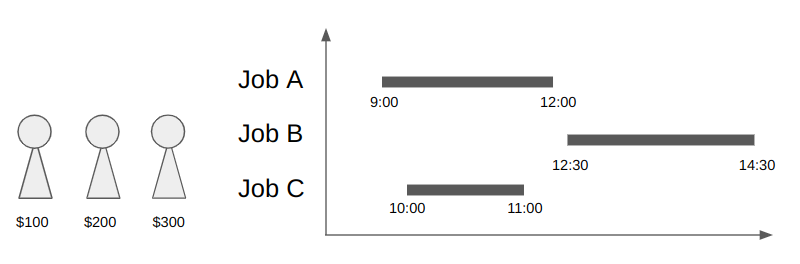
There are three jobs and three workers in this situation. Since job A and B have no overlap. One worker can do these jobs, costing a total $300.
Pre-process
Before constructing a mathematical model, we list overlapping jobs from the given job schedule. First, we prepare the job scheduling data (list of (start_time, end_time)):
from datetime import time
job_list = [
        (time(17, 0), time(18, 0)), # job 0
        (time(13, 0), time(14, 0)), # job 1
        (time(13, 30), time(14, 30)), # job 2
        (time(13, 40), time(14, 40)), # job 3
        (time(16, 40), time(17, 40)), # job 4
        (time(11, 40), time(13, 40)), # job 5
        (time(18, 40), time(19, 40)), # job 6
        (time(18, 40), time(19, 40)), # job 7
        (time(18, 00), time(19, 00)), # job 8
    ]
To find overlapping jobs, we first create a graph whose node i corresponds to each job job_list[i], and the edge connects overlapping jobs.
We need the networkx library to run the below code.
import networkx as nx

def has_overlap(t1start: time, t1end: time, t2start: time, t2end: time):
    return (t1start <= t2start <= t1end) or (t2start <= t1start <= t2end)

def gen_index_graph(time_list: list[tuple[time, time]]) -> nx.Graph:
    G = nx.Graph()
    for j in range(len(time_list)):
        for k in range(j + 1, len(time_list)):
            if has_overlap(
                time_list[j][0], time_list[j][1], time_list[k][0], time_list[k][1]
            ):
                G.add_edge(j, k)

    return G
We can get the list of overlapping jobs by finding cliques from the graph. The function nx.find_cliques can be used for extracting cliques.
g = gen_index_graph(job_list)
job_cliques = []
for c in nx.find_cliques(g):
    job_cliques.append(list(set(c)))

print(job_cliques)
[[0, 8], [0, 4], [1, 2, 3, 5], [8, 6, 7]]
For example, job 0 (from 17:00 to 18:00) and job 8 (from 18:00 to 19:00) has overlap at 18:00 hence it listed as [0, 8].
Job 1, 2, 3, 5 are overlapped each other hence it is also listed.
Mathematical Model
Constants
We use the following constants:
- : The number of workers (e.g.
5) - : The number of jobs (e.g.
5) - : Costs of the worker w. (e.g.
[1,2,3,2,1]) - : List of overlapped jobs (e.g.
[[1,4], [4,2,3,5], [2,3]]. Note that =[1,4], =[4,2,3,5], =[2,3]) - : The number of overlapped jobs (=
len(C))
Decision Variables
A binary variables and are defined as:
for all and .
Objective Functions
The cost function to be minimized is the total cost of workers:
Constraints
We first consider two constraints;
Each job needs one worker
A worker cannot do multiple jobs at the same time. In other words, the number of jobs in that the worker is assigned is 0 (if is 0) or 1 (if is 1).
Modeling by JijModeling
import jijmodeling as jm

W = jm.Placeholder("W")
w = jm.Element("w", belong_to=W)
# jobs
J = jm.Placeholder("J")
j = jm.Element("j", belong_to=J)

# workers cost
b = jm.Placeholder("b", ndim=1)

# list of overlapped jobs
C = jm.Placeholder("C", ndim=2)
# number of cliques
Nc = jm.Placeholder("Nc")
# index for clique
c = jm.Element("c", belong_to=Nc)
l = jm.Element("l", belong_to=C[c])

# decision variables
# 1 if the worker w is assigned, otherwise 0.
y = jm.BinaryVar("y", shape=(W,))
# 1 if the worker w is assigned to job j.
x = jm.BinaryVar("x", shape=(J, W))

problem = jm.Problem("shift schedule")

problem += jm.sum(w, b[w] * y[w])

problem += jm.Constraint("const_do_all_jobs", jm.sum(w, x[j, w]) == 1, forall=[j])

problem += jm.Constraint(
    "const_worker_limit", jm.sum(l, x[l, w]) <= y[w], forall=[w, c]
)

problem
Solve by JijZept
Let us calculate with five workers and five jobs. We can use parameter search algorithm to solve the problem.
import jijzept as jz

workers_costs = [1, 4, 3, 2, 5]
job_list = [
        (time(17, 0), time(18, 0)),
        (time(13, 0), time(14, 0)),
        (time(13, 30), time(14, 30)),
        (time(13, 40), time(14, 40)),
        (time(16, 40), time(16, 50)),
    ]

# Pre-process to job_list
g = gen_index_graph(job_list)
job_cliques = []
for c in nx.find_cliques(g):
    job_cliques.append(list(set(c)))

instance_data = {
            "W": len(workers_costs),
            "J": len(job_list),
            "b": workers_costs,
            "C": job_cliques,
            "Nc": len(job_cliques),
        }

config_path = "config.toml"
sampler = jz.JijSASampler(config=config_path)
response = sampler.sample_model(
    problem, instance_data, search=True, num_search=15
    )

print(response.status)
APIStatus.SUCCESS
Visualization
First, let us check the objective (the cost function) from feasible solutions.
# get sampleset
sampleset = response.get_sampleset()
# extract feasible samples
feasible_samples = sampleset.feasibles()
# get the values of feasible objectives
feasible_objectives = [sample.eval.objective for sample in feasible_samples]
feasible_objectives
[6.0, 6.0, 6.0, 6.0, 6.0, 6.0]
The lowest solution is 6.
Next, we will plot the generated job schedule from the feasible lowest solution.
import matplotlib.pyplot as plt
import numpy as np

def plot_sol(job_list: list[tuple[time, time]], y: list[int], x: list[list[int]]):

    # convert time to sec

    factor = 24 / 86400

    bar_job_list = [((e1.hour*3600 + e1.minute*60 + e1.second) * factor, ((e2.hour*3600 + e2.minute*60 + e2.second) - (e1.hour*3600 + e1.minute*60 + e1.second)) * factor) for e1, e2 in job_list]

    # Horizontal bar plot with gaps
    fig, ax = plt.subplots()
    for i,val in enumerate(y):
        if val == 1:
            bar = []
            for j in range(len(bar_job_list)):
                if x[j, i] == 1:
                    bar.append(bar_job_list[j])

            ax.broken_barh(bar, (10*(i+1)-2.5, 5))

    ax.set_xlim(0, 24)
    ax.set_xlabel("job schedule time [Hour]")
    ax.set_yticks([10*(i+1) for i,_ in enumerate(y)], labels=[f"workers {i}" for i,_ in enumerate(y)])  # Modify y-axis tick labels
    ax.grid(True)  # Make grid lines visible

    plt.show()

# get the index of lowest feasible objective
lowest_index = np.argmin(feasible_objectives)
# get the indices of y == 1
solution_y = feasible_samples[lowest_index].var_values["y"].to_dense()
# get the indices of x == 1
solution_x = feasible_samples[lowest_index].var_values["x"].to_dense()
plot_sol(job_list, solution_y, solution_x)
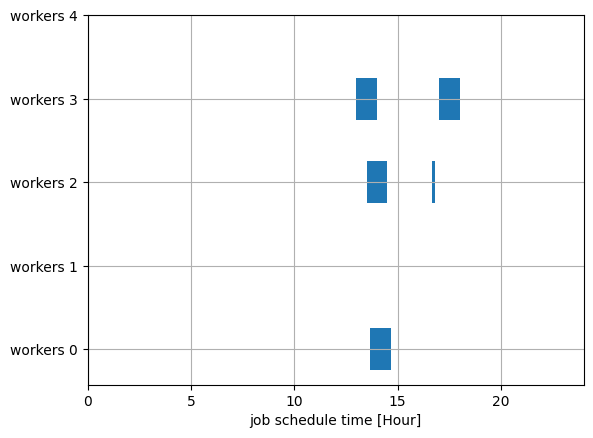
The blue area shows each job. You can see that only three workers can do the jobs, and the total cost is 1+2+3=6.
Other Cases
Let us consider if all jobs are overlapped.
import jijzept as jz

workers_costs = [1, 4, 3, 2, 5]
job_list = [
        (time(10, 10), time(19, 0)),
        (time(10, 20), time(19, 0)),
        (time(10, 30), time(19, 30)),
        (time(10, 0), time(19, 40)),
        (time(10, 0), time(19, 50)),
    ]

# Pre-process to job_list
g = gen_index_graph(job_list)
job_cliques = []
for c in nx.find_cliques(g):
    job_cliques.append(list(set(c)))

instance_data = {
            "W": len(workers_costs),
            "J": len(job_list),
            "b": workers_costs,
            "C": job_cliques,
            "Nc": len(job_cliques),
        }

sampler = jz.JijSASampler(config=config_path)
res = sampler.sample_model(
    problem, instance_data, search=True, num_search=15
    )

# get the index of lowest feasible objective
lowest_index = np.argmin(feasible_objectives)
# get the indices of y == 1
solution_y = feasible_samples[lowest_index].var_values["y"].to_dense()
# get the indices of x == 1
solution_x = feasible_samples[lowest_index].var_values["x"].to_dense()
plot_sol(job_list, solution_y, solution_x)
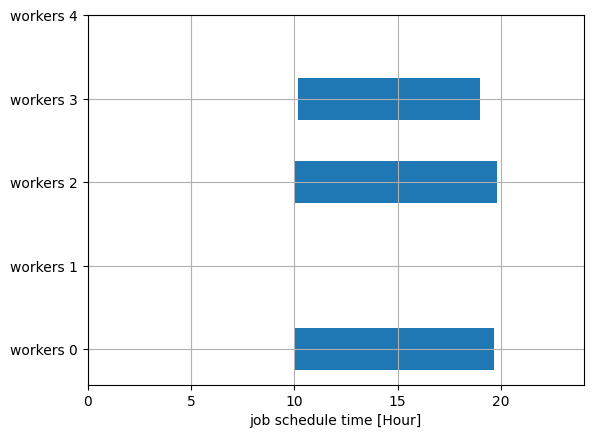
In this case, we need all workers to finish jobs.